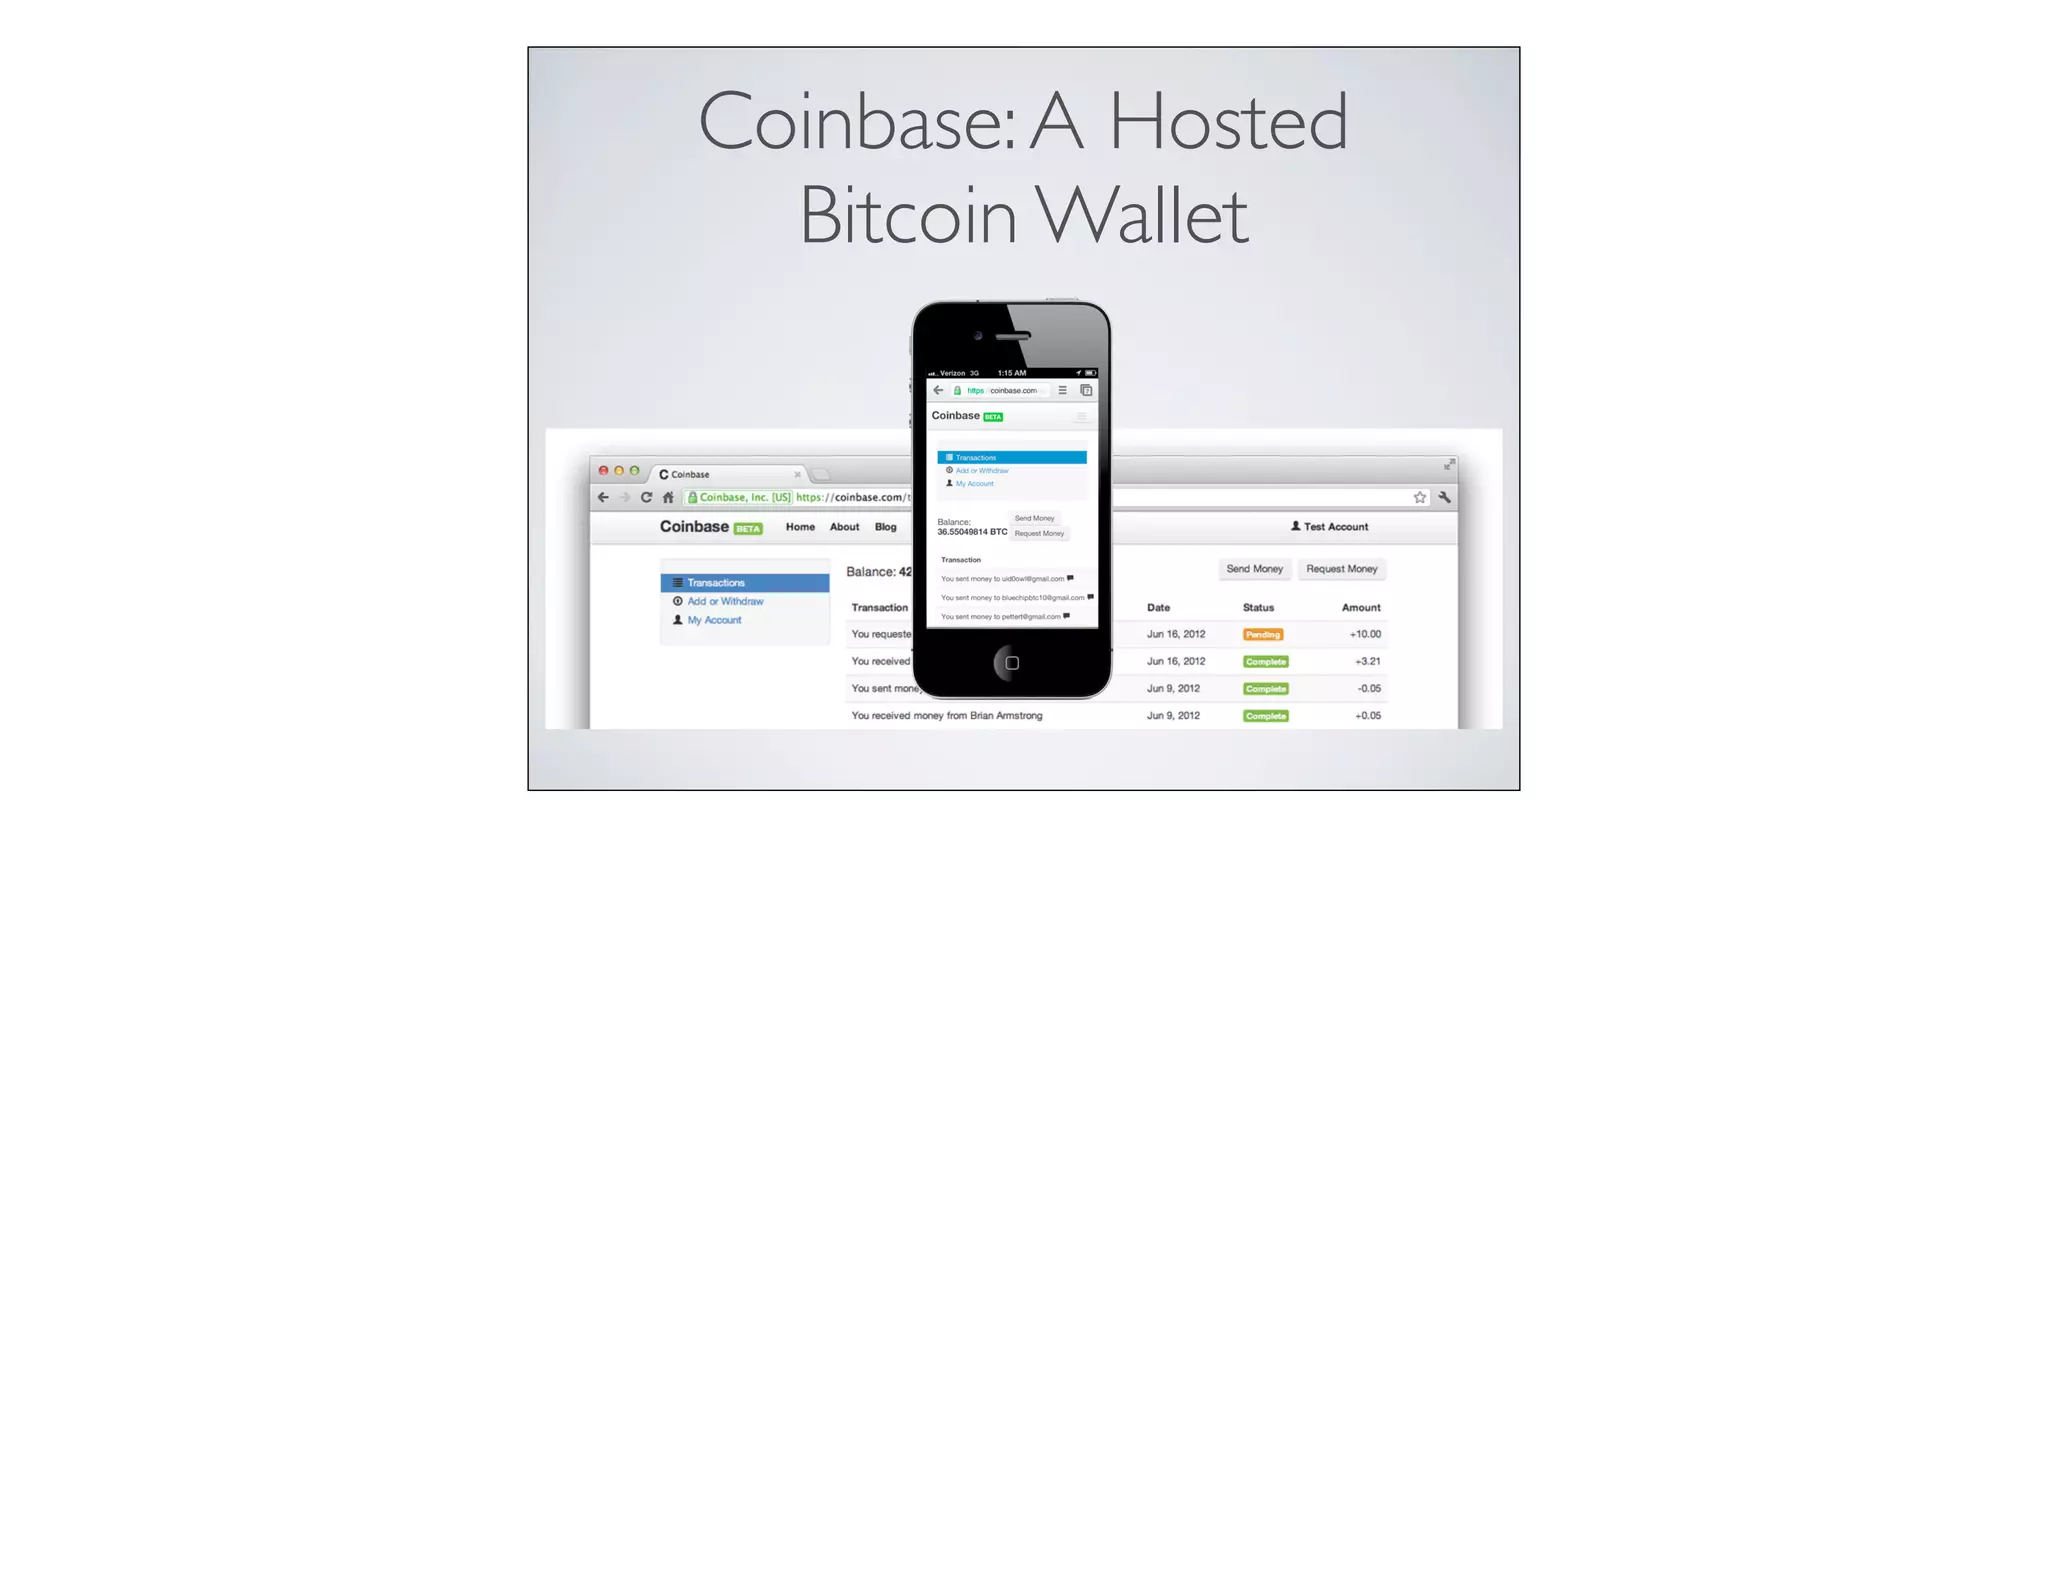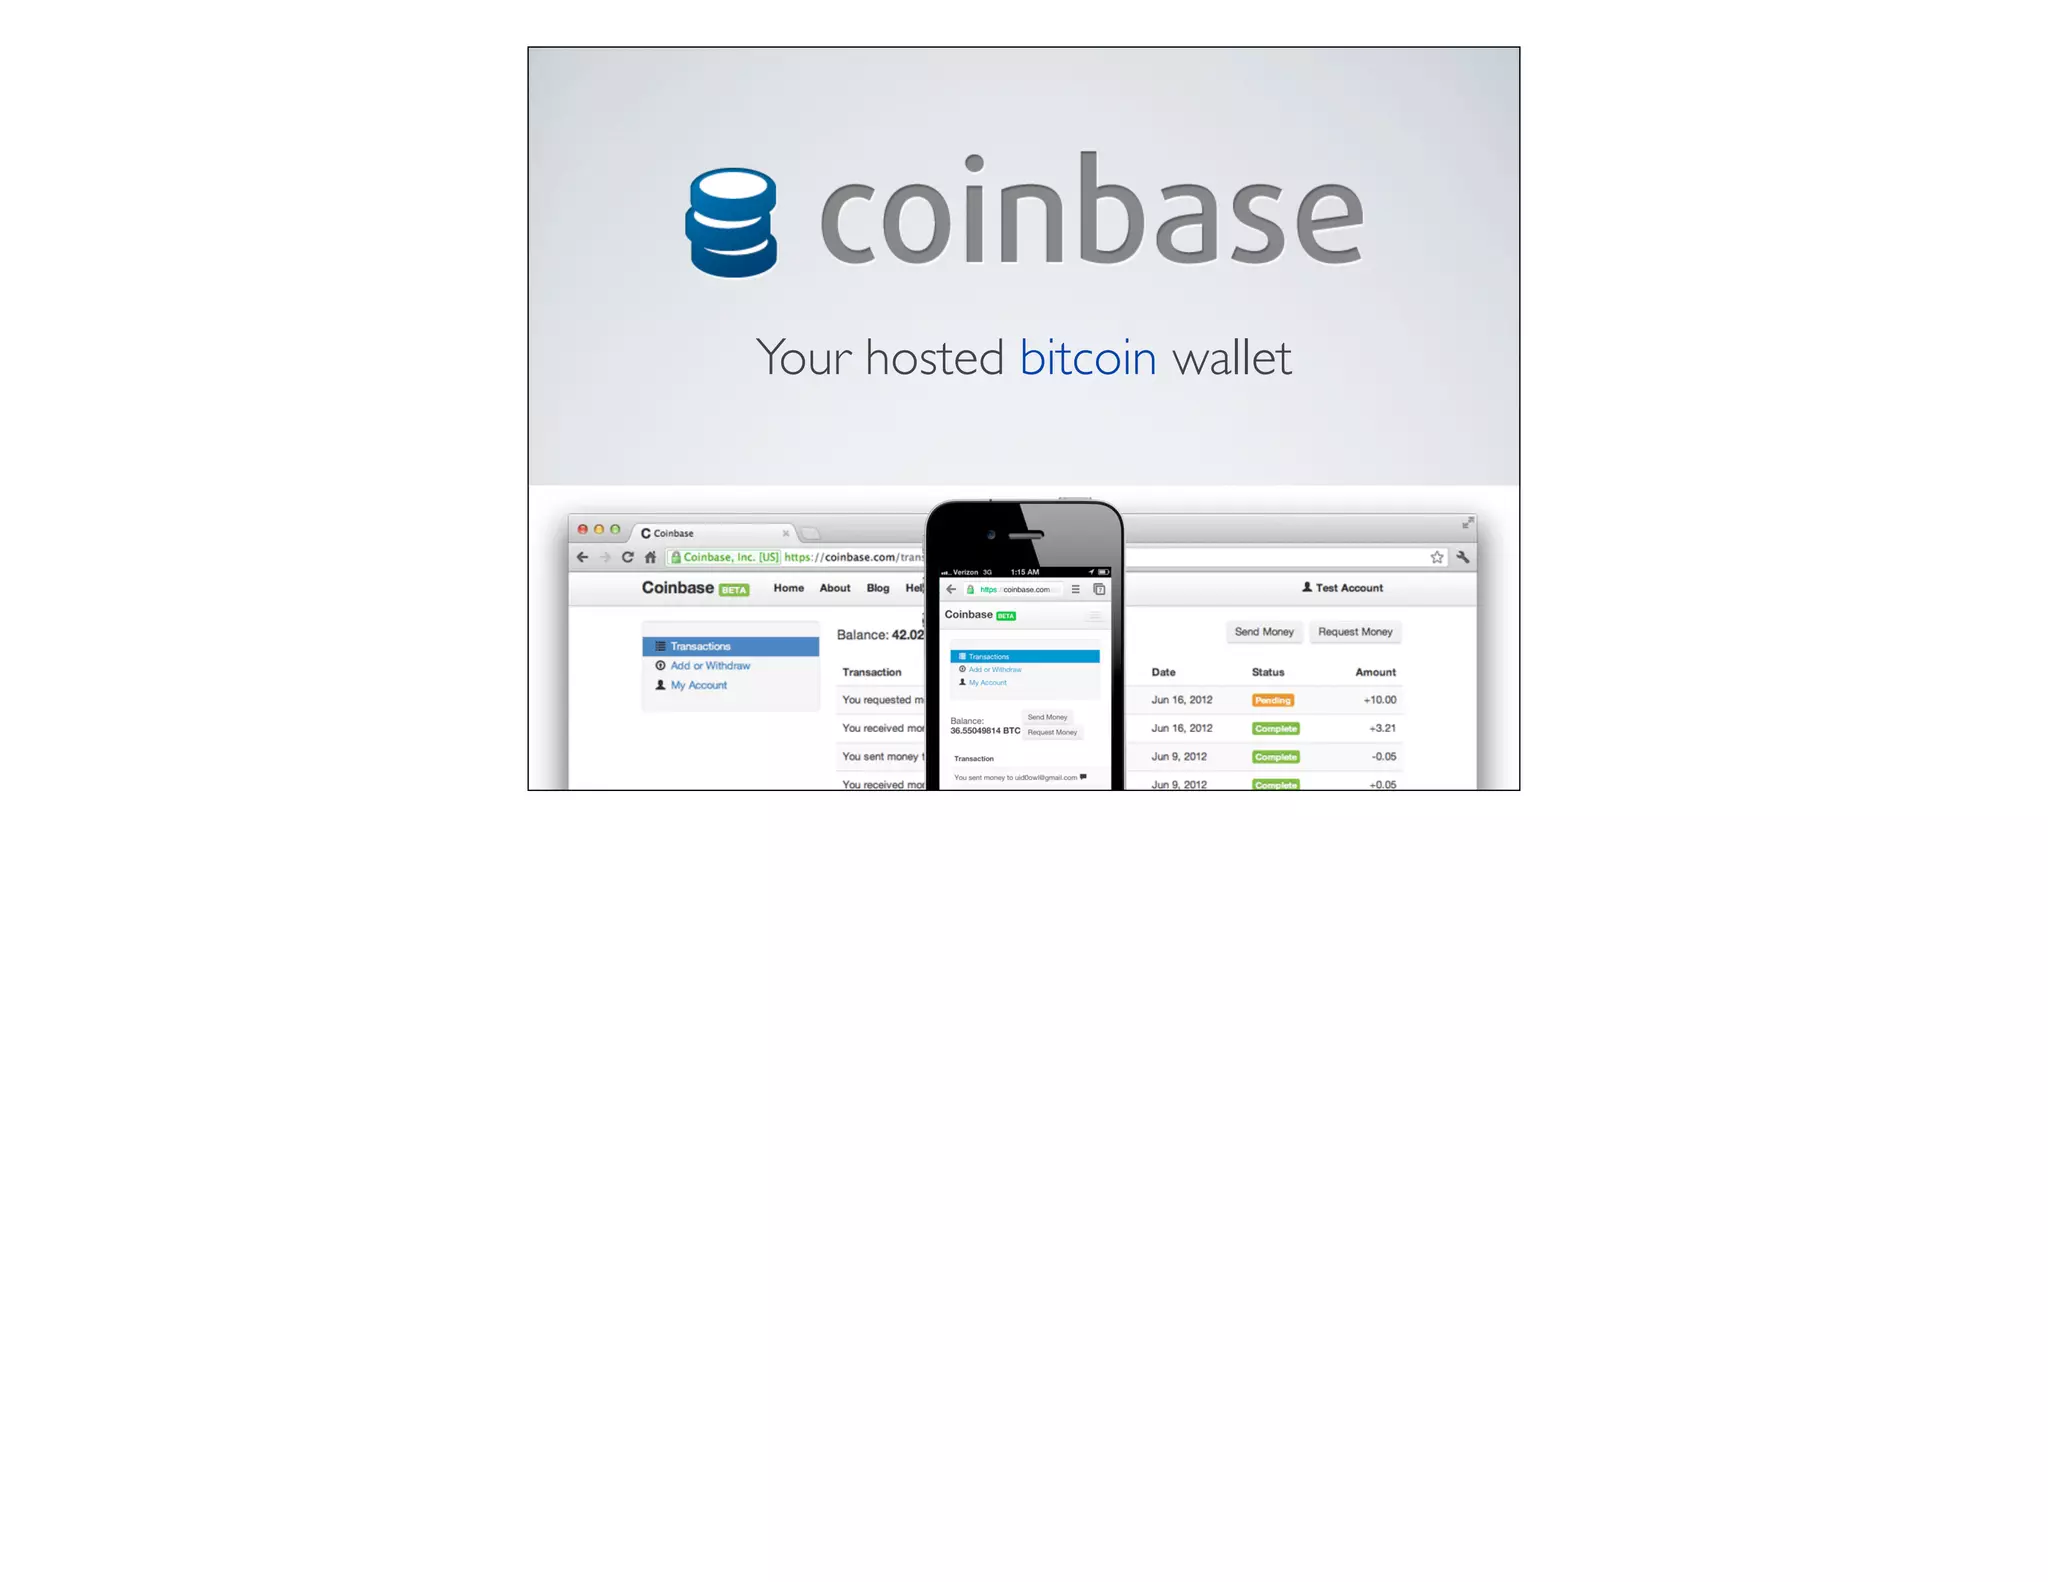
The Opening: Clear Branding and Positioning
The cover slide presents the Coinbase name, logo, and the short, declarative tagline “Your hosted bitcoin wallet.” It uses a clean visual hierarchy: large brand mark at top, concise value proposition, and a visual of the product on multiple devices. This immediately tells the audience what the company does and suggests credibility (a polished UI and mobile presence) without needing technical explanation.
Founders can learn from the focus and simplicity here. The slide avoids jargon and uses the product image to convey trust and usability, which is especially important for a finance product. The visual cue of both desktop and mobile screens signals that Coinbase is a real product, not just an idea, which helps set expectations for the rest of the deck.