Stack up against WeWork

Compare Your Deck
Cautionary Tale

WeWork's 2014 Pitch Deck

Cautionary Tales
Stage: Series D
Raised: $335M
Year: 2014
Slides: 36
Outcome: FAILED IPO, massive writedown

Pitch Deck

1 / 36
Slide 1
Click to expand

Deck Analysis

This Series D pitch deck from WeWork (2014) presents a highly visual, founder-driven story: aspirational branding, rapid membership growth, a platform thesis (“Space as a Service”), and a path to monetization through services. The deck emphasizes network effects, unit-level economics, and a large addressable market while showcasing traction, pipeline and landlord partnerships. It’s notable because the presentation packages an emotional vision with crisp KPIs and bold forward projections — yet the company later failed to IPO as expected and suffered a large writedown, making the deck a useful study in persuasive storytelling versus execution and transparency.

Opening & Brand Positioning: Emotion first

Opening & Brand Positioning: Emotion first

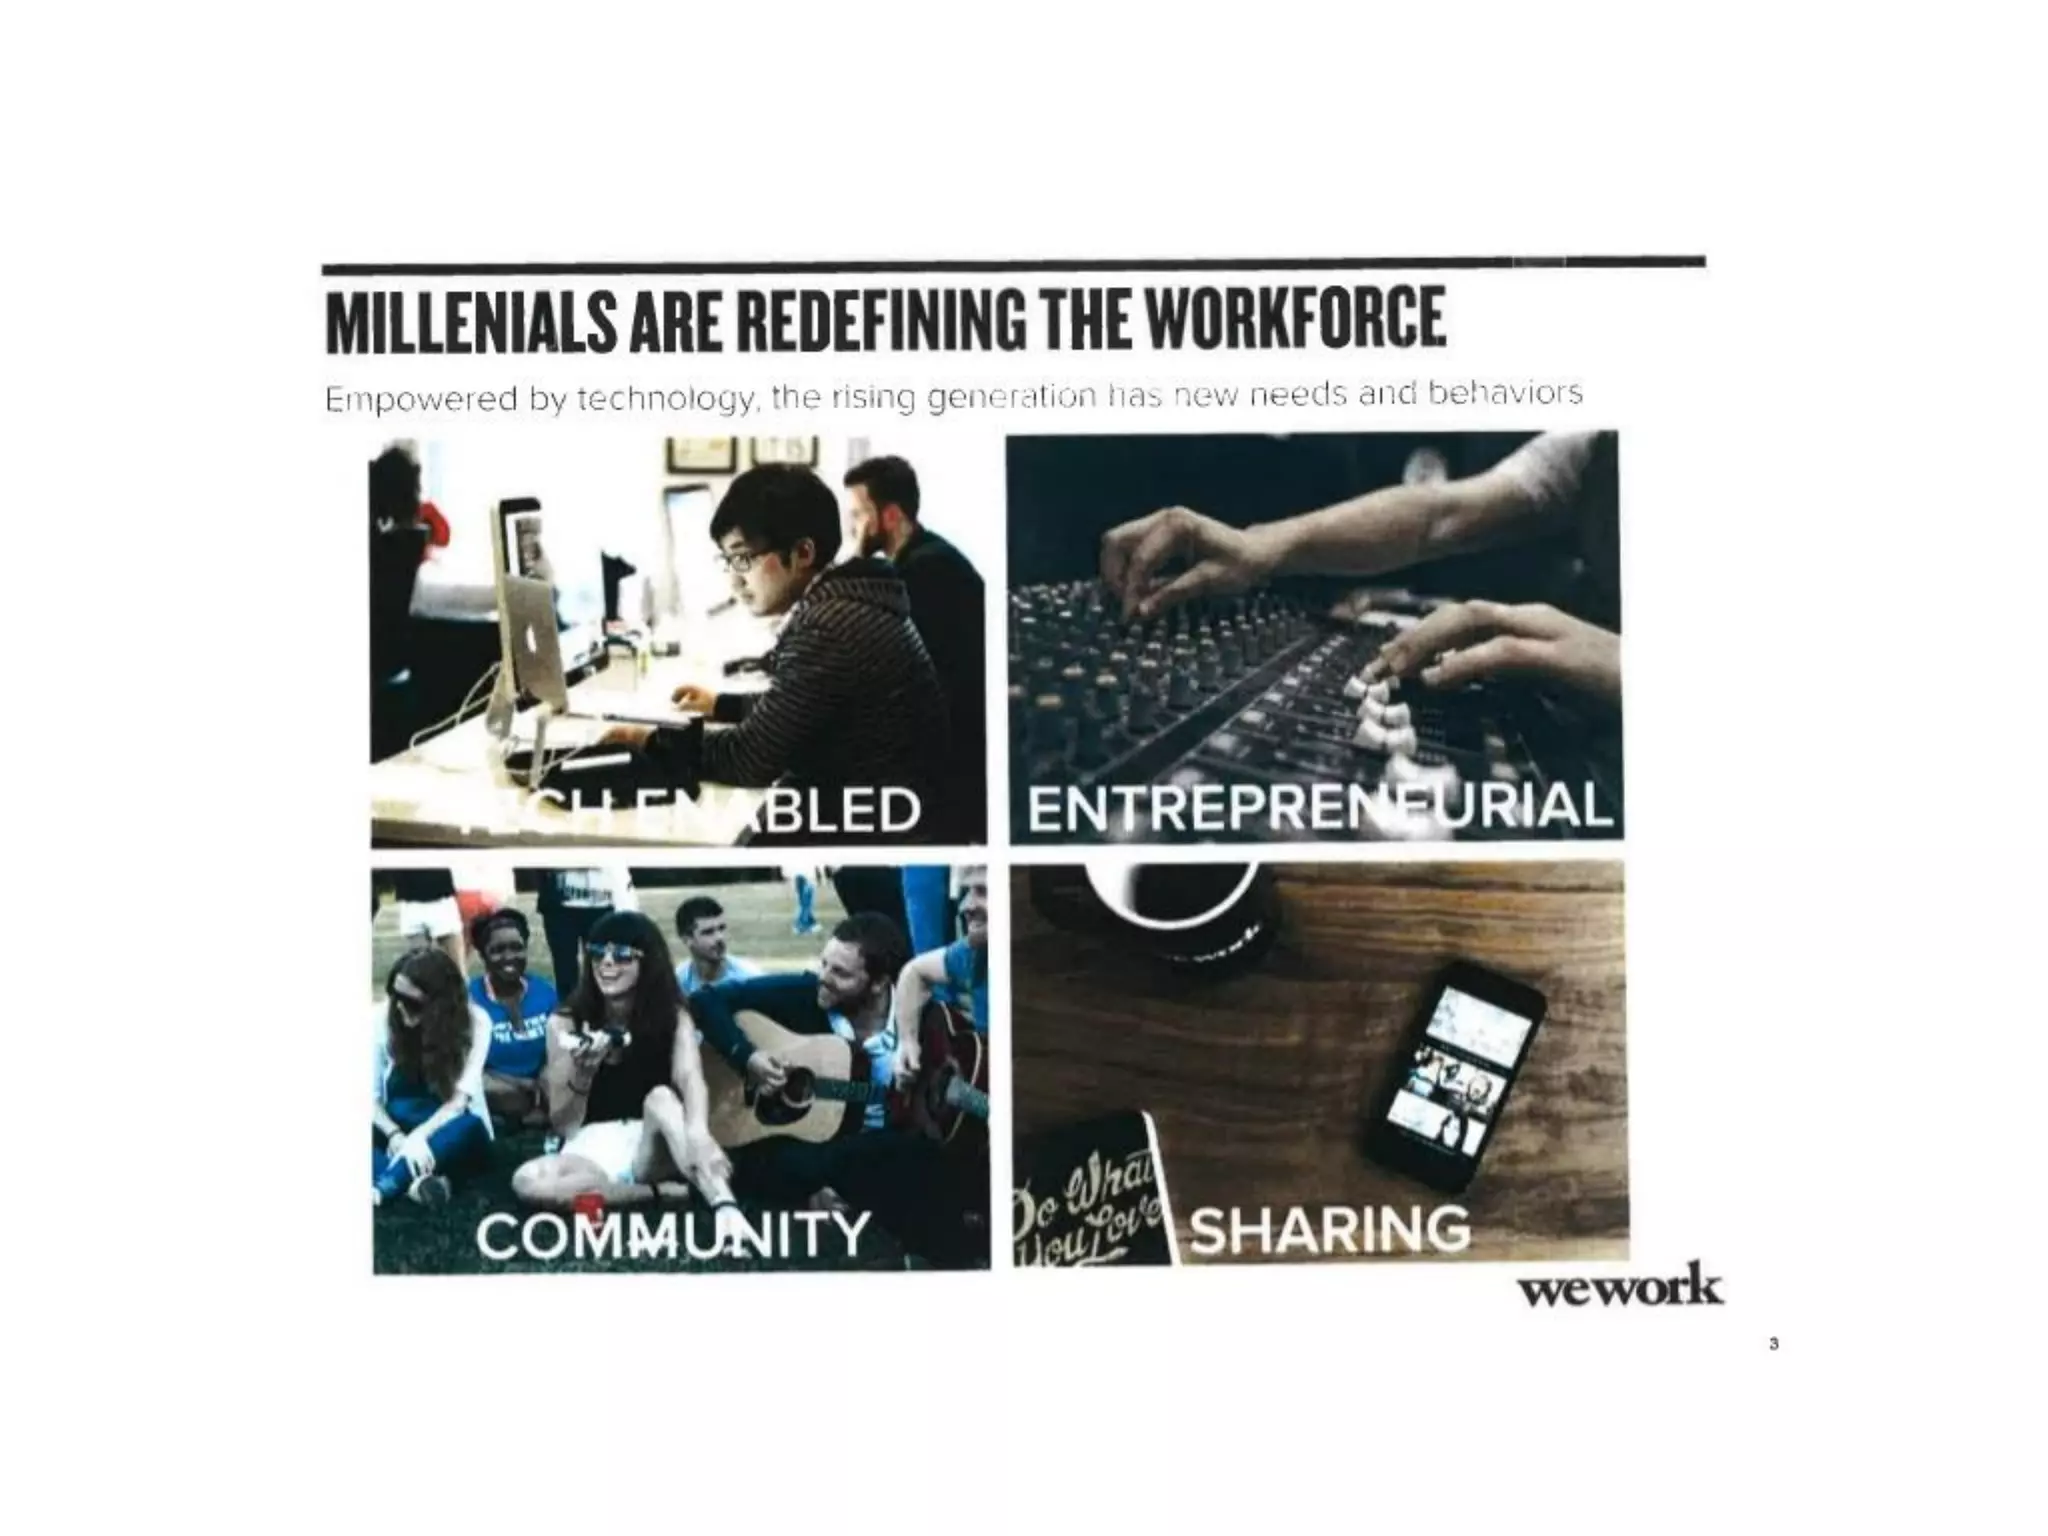
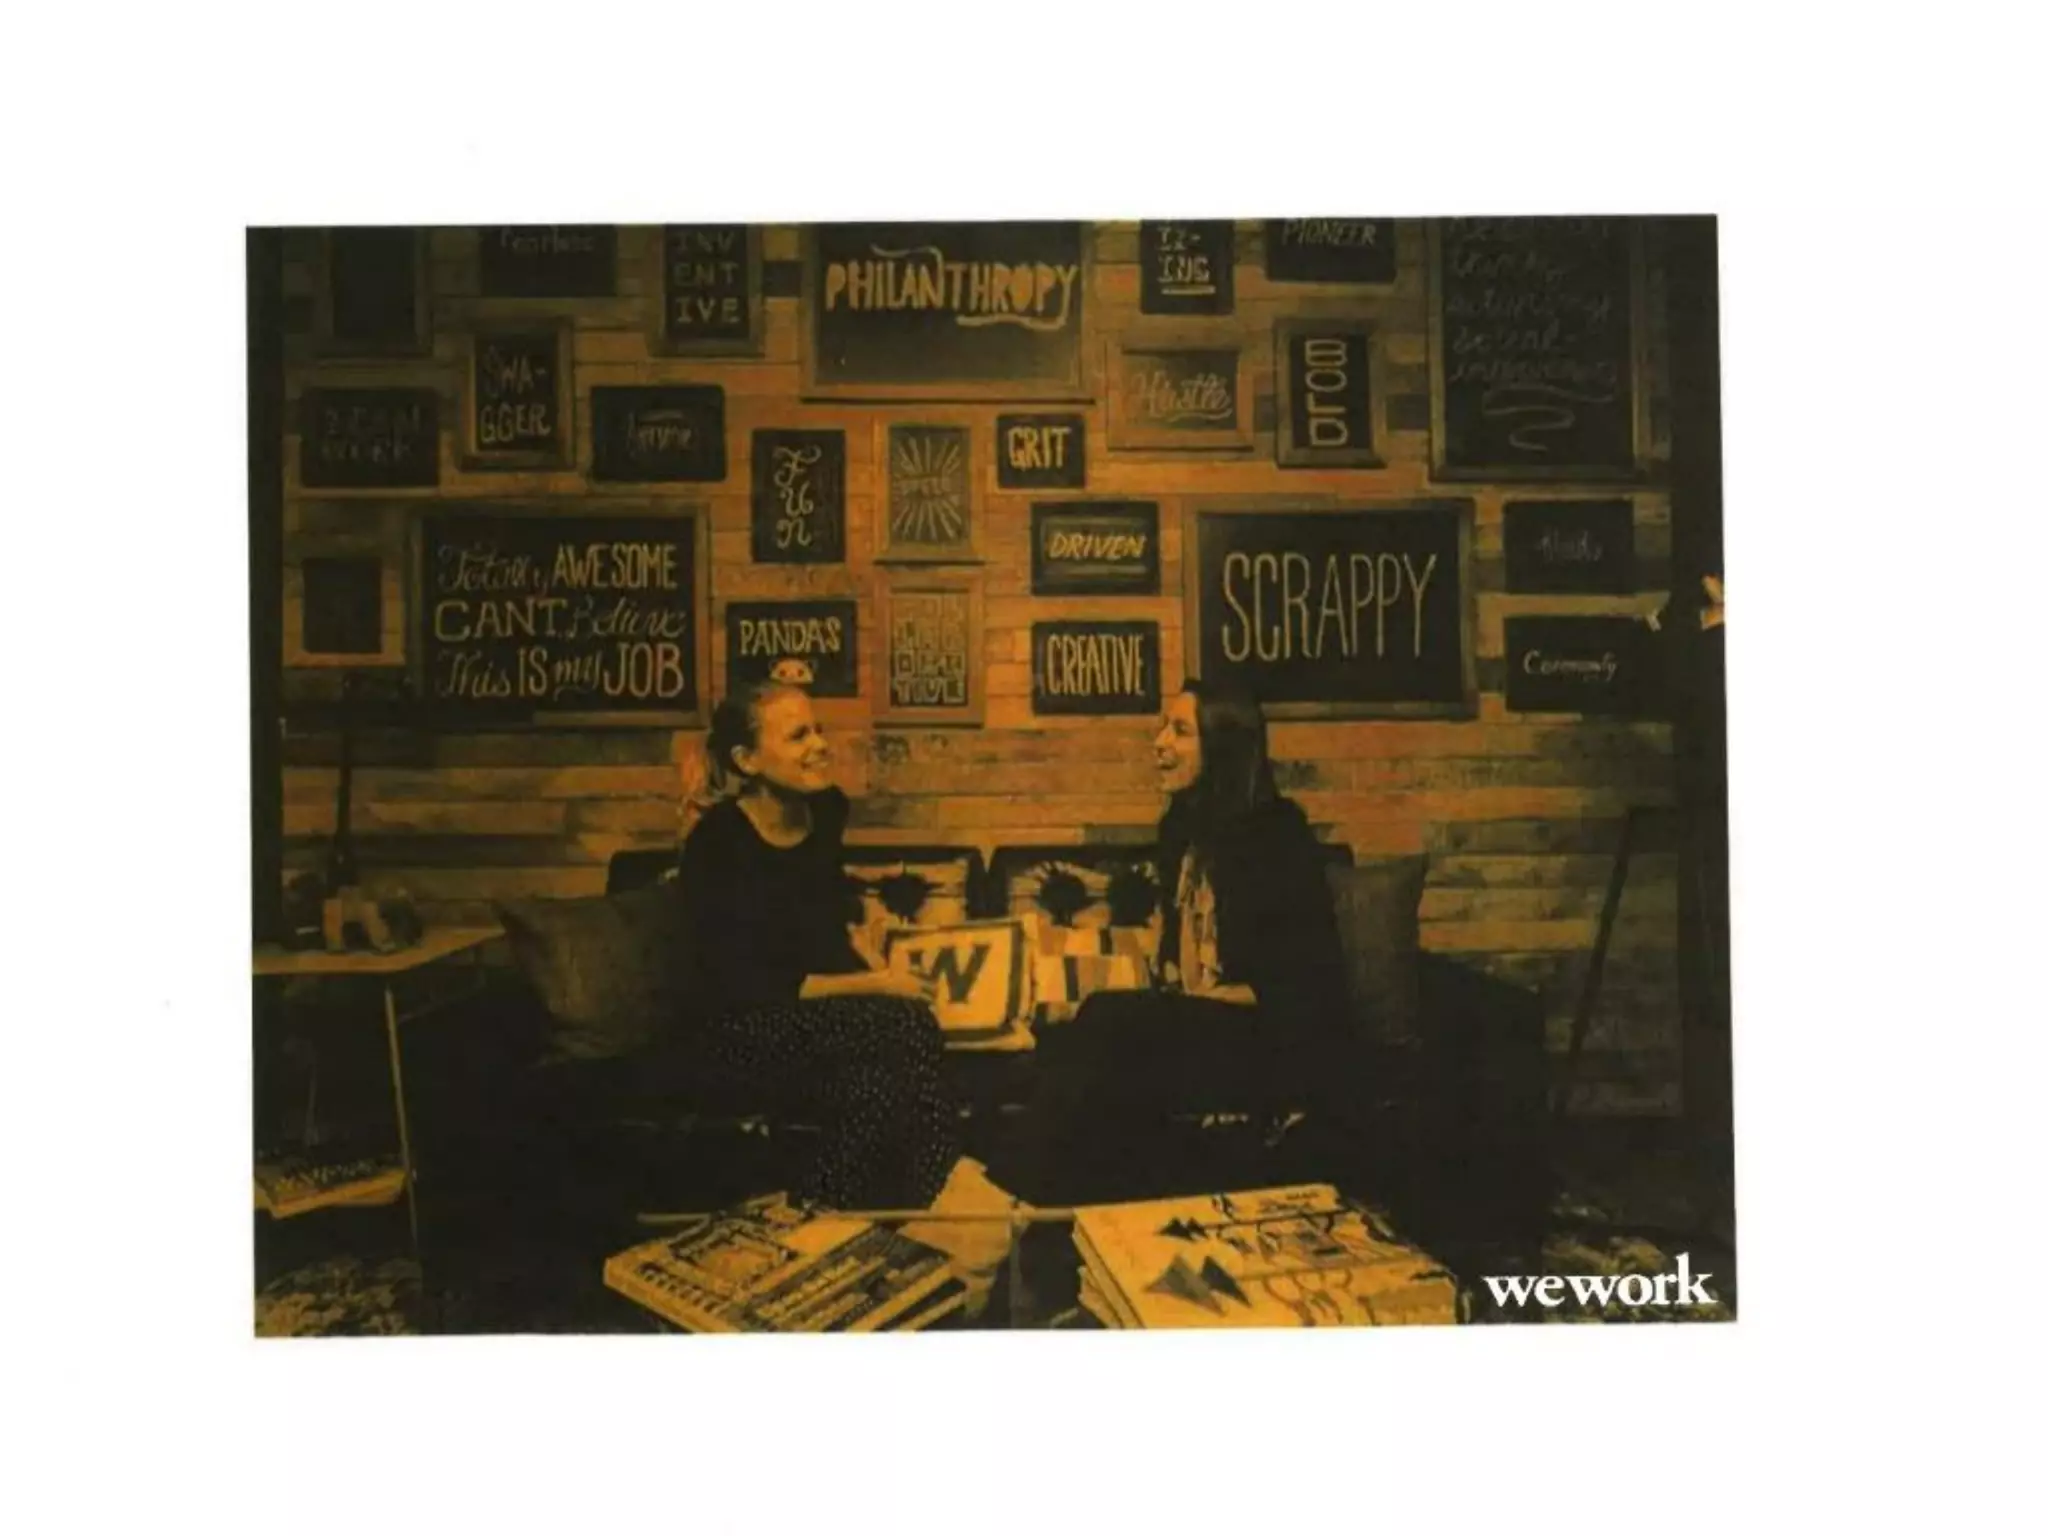
Slide 1 is a single-image opener that sets tone more than data: a monochrome photograph with the phrase “Do What You Love,” and subtle branding. It uses emotion to create immediate alignment with the audience (investors who respond to mission-driven narratives) and primes viewers to see the product as cultural rather than purely functional. This is effective at capturing attention and framing the deck’s thesis around lifestyle, community and identity rather than just square footage or lease terms.

Founders can learn the power of a purposeful opener: a short, memorable, emotionally resonant visual that supports the company’s differentiator. However, this kind of opener works best when followed quickly by crisp evidence — growth, unit economics and defensibility — because strong emotion can otherwise obscure important operational risks.

Key Takeaway: Open with a clear emotional hook that encapsulates your mission, but immediately follow it with measurable traction and clear economic logic.
Company Overview & Traction: Data up front

Company Overview & Traction: Data up front

Slide 2 consolidates the most persuasive high-level facts: founding date, employees, locations, member counts, average revenue per member, occupancy rates and an abbreviated financial snapshot. There’s also a rapid-growth bar chart showing members over time. This is a classic investor-focused move — put the key metrics and growth trajectory early so investors can anchor their attention on scale and momentum.

The layout balances qualitative facts (locations, team size) with hard KPIs (ARPM, occupancy, EBITDA margin at mature locations), which helps the narrative move from mission to plausibility. Founders should emulate this by surfacing a one-page summary of the company’s most important metrics early; however, make sure those metrics are conservative and footnoted if necessary — overstated or unclear metrics will be the first thing skeptics challenge.

Key Takeaway: Lead with a concise metrics page that combines traction, unit economics and key operational data to quickly build investor confidence.
Value Proposition — ‘Space as a Service’

Value Proposition — ‘Space as a Service’

Slide 3 lays out the company’s core proposition: offering working and living spaces optimized for modern, mobile, creative workers. The slide enumerates macro trends (technology, urbanization, demographics), the company’s proprietary ecosystem and the size of the addressable market. This is effective because it connects product features to larger secular trends and articulates why demand is structural, not ephemeral.

The slide also attempts to justify scale economics and a first-mover advantage (projecting a $1B run-rate by 2016). For founders, the lesson is to pair product benefits with macro tailwinds and explain how your model captures value at scale. Be careful: strong forward-looking claims should be supported by conservative underpinnings and sensitivity analysis, since aggressive upside projections invite close scrutiny.

Key Takeaway: Frame your product around enduring macro trends and show how your model captures structural value — but temper optimistic projections with clear assumptions.
Unit Economics & Proof Points: Claimed profitability

Unit Economics & Proof Points: Claimed profitability

Slide 12 presents the company’s unit-level economics and claims near-100% occupancy at mature locations with average unit EBITDA margins >40%. The slide lists desks, license fees per member, service revenue per member, rent & OpEx and derives Unit EBITDA and margin by location. This is the type of slide investors pore over — it’s where the story of scalable, repeatable economics must either stand or fall.

The lesson is twofold: (1) show real, location-level P&Ls to prove economics rather than aggregate top-line numbers; (2) disclose underlying assumptions (ramp time, capex, landlord contributions). WeWork used location examples to prove the concept, which is smart, but future founders should also include sensitivity ranges and conservative scenarios because reputational risk and capital providers punish undisclosed downside sensitivities.

Key Takeaway: Back your growth story with granular, location-level economics and transparent assumptions — and include downside sensitivity to build credibility.
Growth, Pipeline & Network Effects

Growth, Pipeline & Network Effects

Slide 13 demonstrates rapid top-line acceleration with an annualized membership fee revenue chart and a projection of 225% growth in 2015. Nearby slides (wework effect, pipeline maps) emphasize network effects: more community activity drives both demand and supply advantages (landlord deals, more locations). Presenting both a historical growth curve and a pipeline map is powerful: it shows not just what you’ve done, but where the company will scale next.

Founders should show both realized growth and a validated, staged pipeline — including signed locations, under-development and term-sheet agreements — rather than vague ‘target’ markets. However, be realistic about conversion from pipeline to revenue. Overstating how quickly pipeline converts into operating assets is a common pitfall that can turn a persuasive growth slide into a credibility gap.

Key Takeaway: Combine historical traction with a documented, staged pipeline and explicit conversion assumptions to make growth projections believable.
Monetization & Services Roadmap

Monetization & Services Roadmap

Slide 26 outlines how WeWork planned to layer services on top of membership — telephone, conference, printing today; partnerships (TriNet, GA, momofuku, etc.) and future services to increase revenue per member from $28 toward $75+ per month. The slide ties product expansion to revenue uplift and projects large service revenue outcomes tied to the member base ramp. It shows a clear product-led monetization pathway rather than relying solely on real estate appreciation.

For founders, this is a good template: show a roadmap of incremental monetization, a timeline for adoption and concrete partners who validate demand. Also demonstrate how much incremental margin each service contributes and how cross-selling scales. The danger is overestimating per-member take rates or assuming partner economics without signed agreements — make sure to show pilot results, contractual commitments or conservative uptake rates to strengthen the case.

Key Takeaway: Present a service expansion roadmap with partner validation and conservative uptake assumptions to credibly increase revenue per customer.

Conclusion: Key Lessons

WeWork’s Series D deck is a strong example of narrative-driven fundraising: it pairs a compelling brand and mission with growth metrics, unit economics and a monetization roadmap. The deck’s strengths are visual storytelling, early placement of traction metrics, and an articulated view of network effects and service expansion. These elements work together to create urgency and belief in a large, structural opportunity.

The cautionary lessons are equally important. Founders must temper ambition with transparent assumptions, granular unit economics and conservative scenarios. Bold projections and cultural narratives attract attention, but long-term credibility with investors requires disciplined disclosure (sensitivity analysis, pilot data, signed deals) and realistic timelines for pipeline conversion and capital intensity. Use emotion to open interest, but use rigorous, provable data to sustain it.